Examples
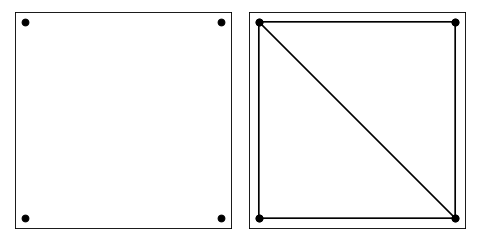
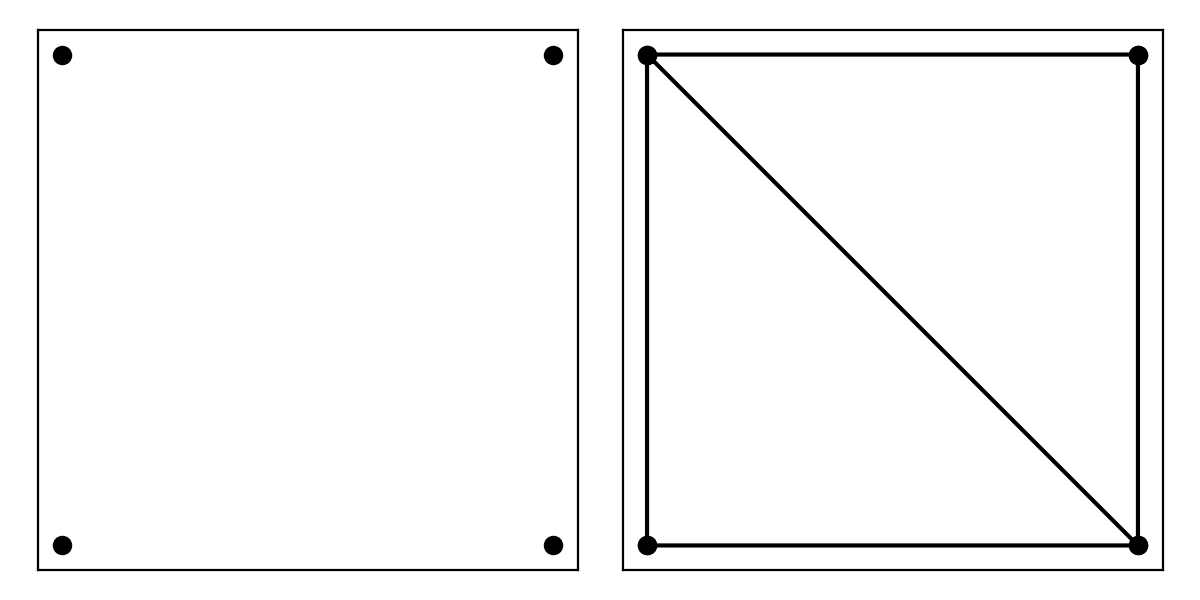
Let us triangulate a simple square
import matplotlib.pyplot as plt
import numpy as np

import triangle as tr

A = dict(vertices=np.array(((0, 0), (1, 0), (1, 1), (0, 1))))
B = tr.triangulate(A)
tr.compare(plt, A, B)
plt.show()
(Source code, png, hires.png, pdf)

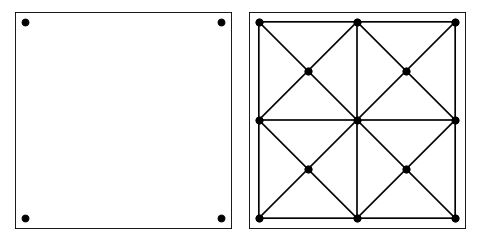
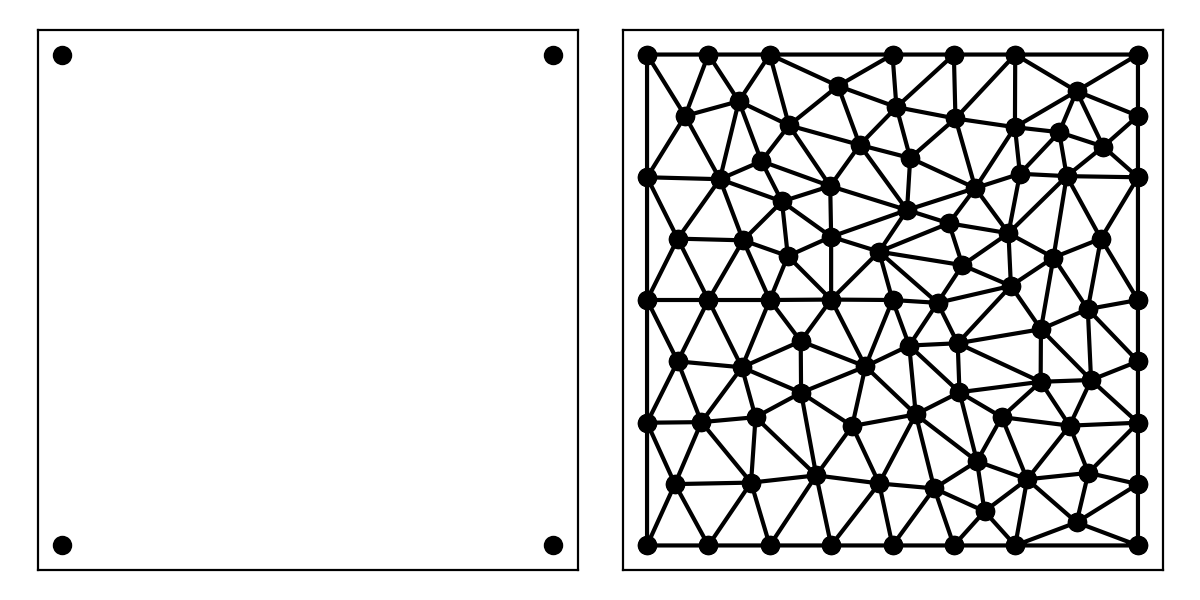
In order to set maximum area of the triangles, we set the maxarea keyword
import matplotlib.pyplot as plt
import numpy as np

import triangle as tr

A = dict(vertices=np.array(((0, 0), (1, 0), (1, 1), (0, 1))))
B = tr.triangulate(A, 'qa0.1')
tr.compare(plt, A, B)
plt.show()
(Source code, png, hires.png, pdf)

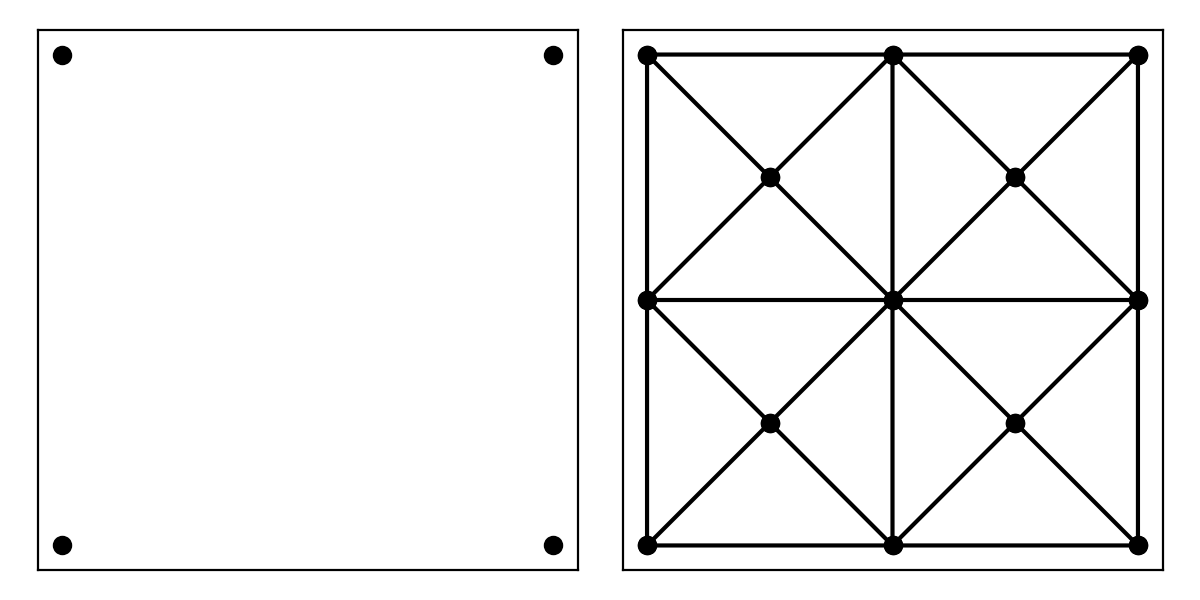
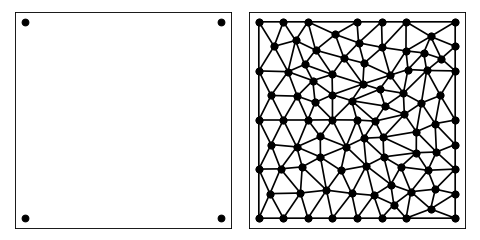
If we want to decrease the area even further
import matplotlib.pyplot as plt
import numpy as np

import triangle as tr

A = dict(vertices=np.array(((0, 0), (1, 0), (1, 1), (0, 1))))
B = tr.triangulate(A, 'qa0.01')
tr.compare(plt, A, B)
plt.show()
(Source code, png, hires.png, pdf)
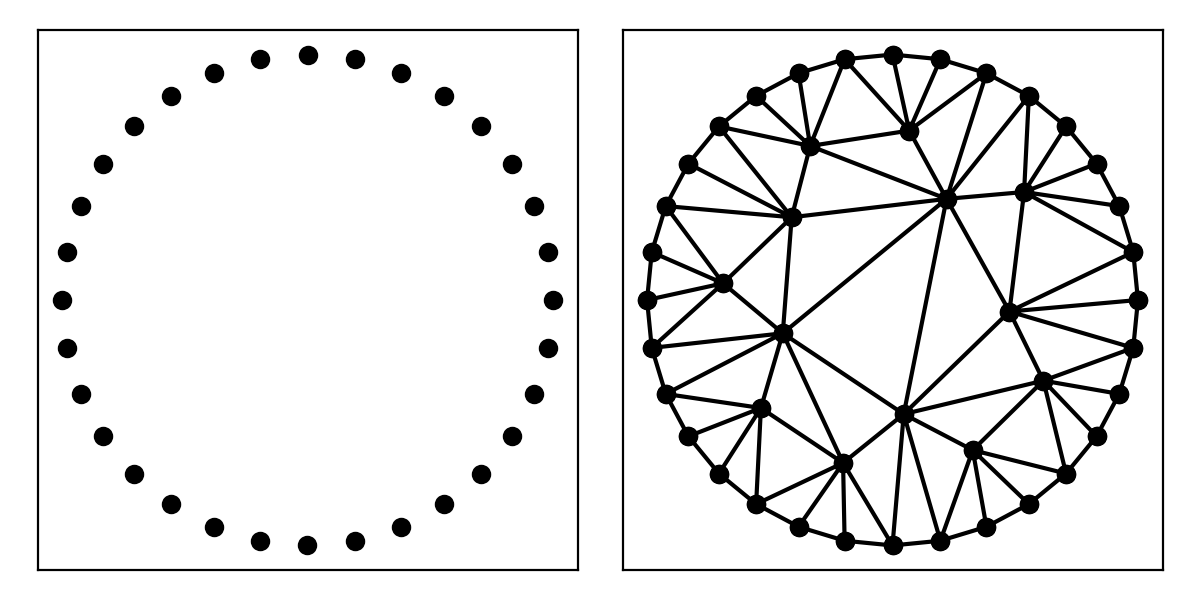
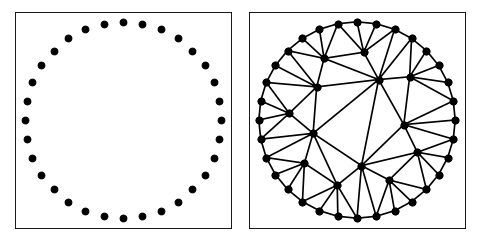
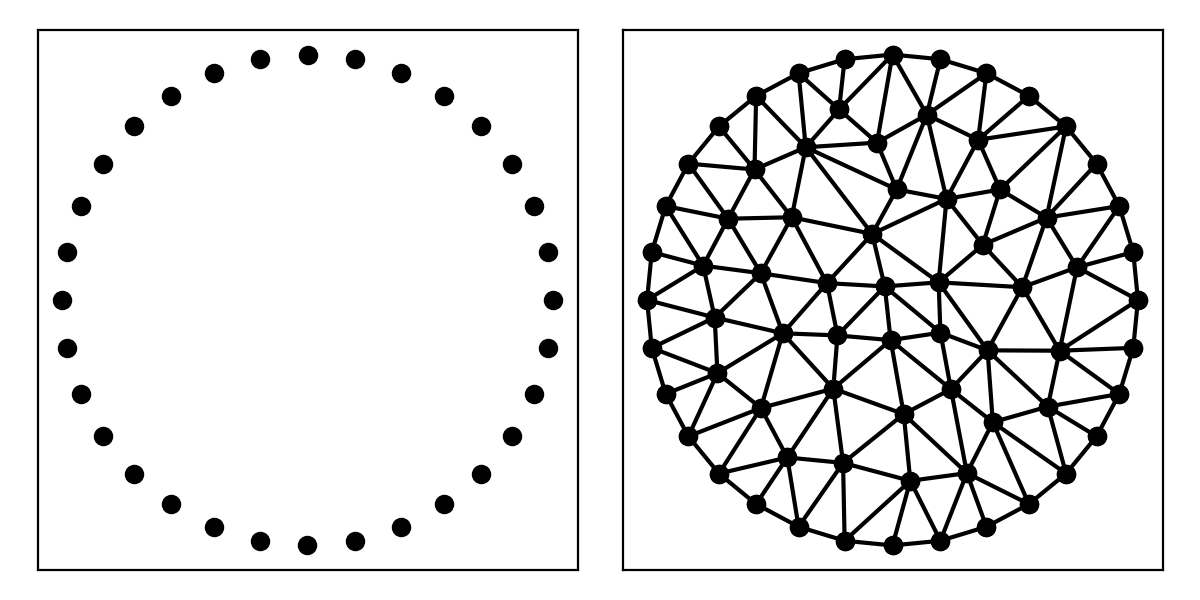
To do the same with a circle
import matplotlib.pyplot as plt
import numpy as np

import triangle as tr

N = 32
theta = np.linspace(0, 2 * np.pi, N, endpoint=False)
pts = np.stack([np.cos(theta), np.sin(theta)], axis=1)
A = dict(vertices=pts)
B = tr.triangulate(A, 'q')
tr.compare(plt, A, B)
plt.show()
(Source code, png, hires.png, pdf)
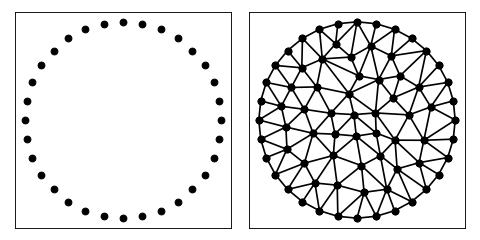
import matplotlib.pyplot as plt
import numpy as np

import triangle as tr

N = 32
theta = np.linspace(0, 2 * np.pi, N, endpoint=False)
pts = np.stack([np.cos(theta), np.sin(theta)], axis=1)
A = dict(vertices=pts)
B = tr.triangulate(A, 'qa0.05')
tr.compare(plt, A, B)
plt.show()
(Source code, png, hires.png, pdf)
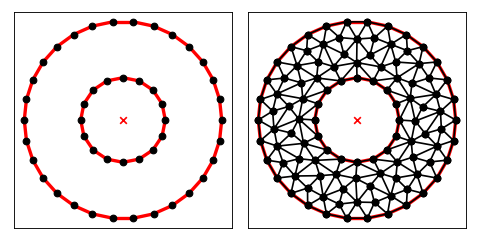
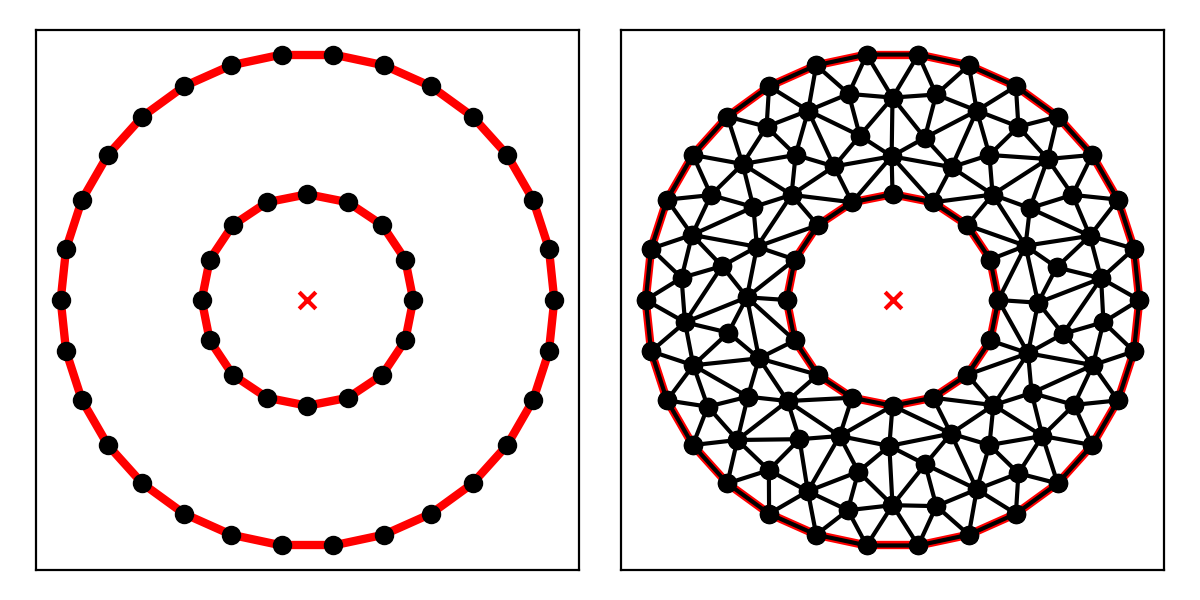
To add a hole in the middle of the circle
import matplotlib.pyplot as plt
import numpy as np

import triangle as tr


def circle(N, R):
    i = np.arange(N)
    theta = i * 2 * np.pi / N
    pts = np.stack([np.cos(theta), np.sin(theta)], axis=1) * R
    seg = np.stack([i, i + 1], axis=1) % N
    return pts, seg


pts0, seg0 = circle(30, 1.4)
pts1, seg1 = circle(16, 0.6)
pts = np.vstack([pts0, pts1])
seg = np.vstack([seg0, seg1 + seg0.shape[0]])

A = dict(vertices=pts, segments=seg, holes=[[0, 0]])
B = tr.triangulate(A, 'qpa0.05')
tr.compare(plt, A, B)
plt.show()
(Source code, png, hires.png, pdf)

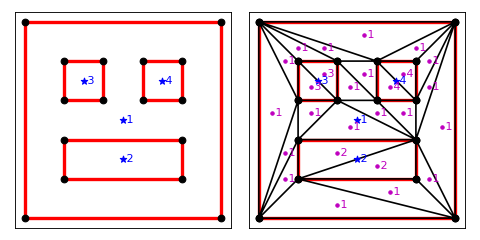
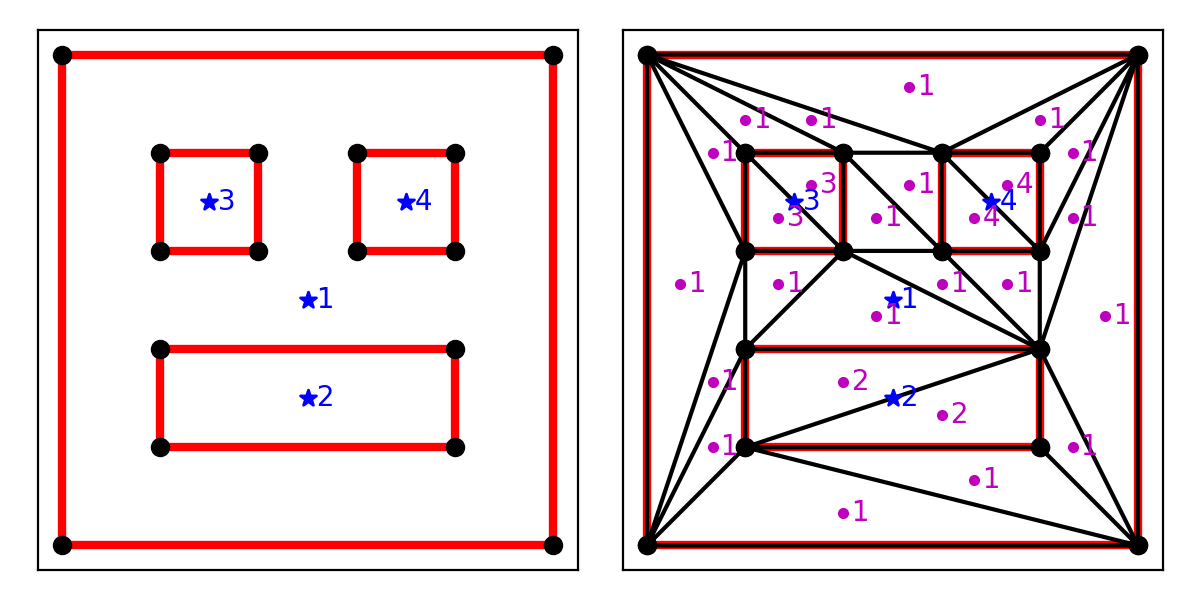
To triangulate with region attributes
import matplotlib.pyplot as plt
import numpy as np

import triangle as tr

# arrays to fill in with input
vertices = []
segments = []
regions = []


# make a box with given dims and place given attribute at its center
def make_box(x, y, w, h, attribute):

    i = len(vertices)

    vertices.extend([
        [x, y],
        [x + w, y],
        [x + w, y + h],
        [x, y + h],
    ])

    segments.extend([
        (i + 0, i + 1),
        (i + 1, i + 2),
        (i + 2, i + 3),
        (i + 3, i + 0),
    ])

    regions.append([x + 0.5 * w, y + 0.5 * h, attribute, 0])


# generate some input
make_box(0, 0, 5, 5, 1)
make_box(1, 1, 3, 1, 2)
make_box(1, 3, 1, 1, 3)
make_box(3, 3, 1, 1, 4)

A = dict(vertices=vertices, segments=segments, regions=regions)
B = tr.triangulate(A, 'pA')

tr.compare(plt, A, B)
plt.show()
(Source code, png, hires.png, pdf)
